Eventbrite // Event Reporting
Eventbrite needed to bring reporting capabilities into the service as the old method was to generate tabular data reports which then had to be exported, downloaded and processed in an application like Excel to visualize event data.
Extensive work went into the design of the various data visualizations, report setup and management and cross-event reporting UI redesign. Every bit of reporting was mocked up and then assembled into a product spec outlining all functionality and behavior of the reporting system.
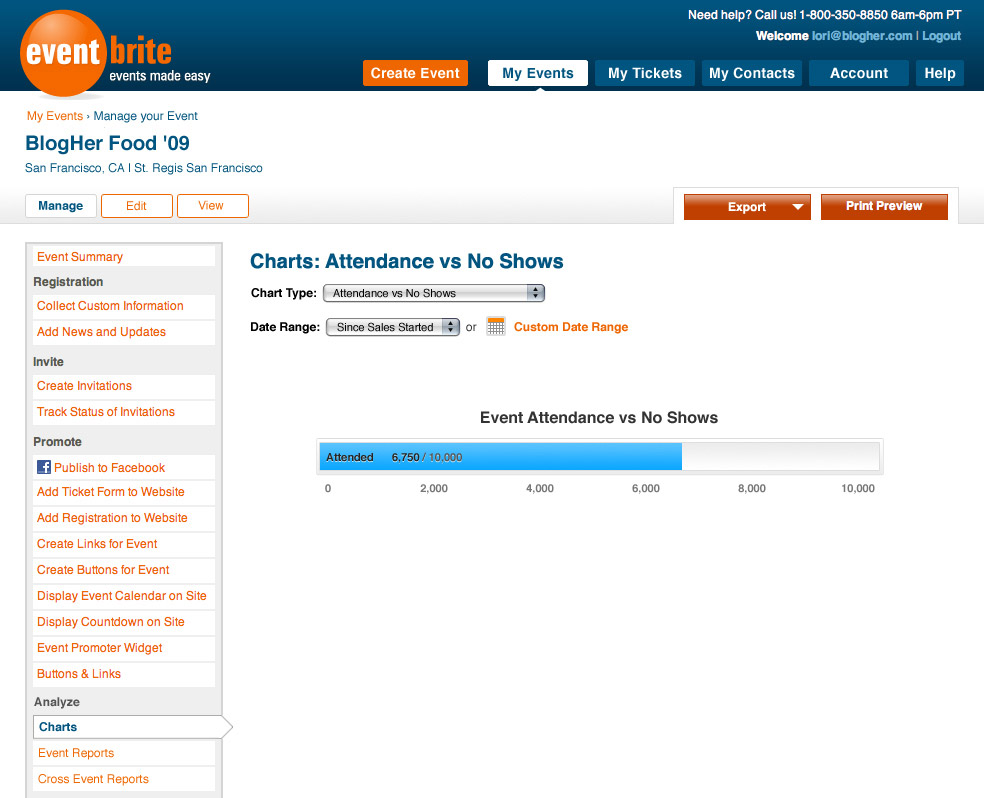
Chart: Attendance vs No Shows
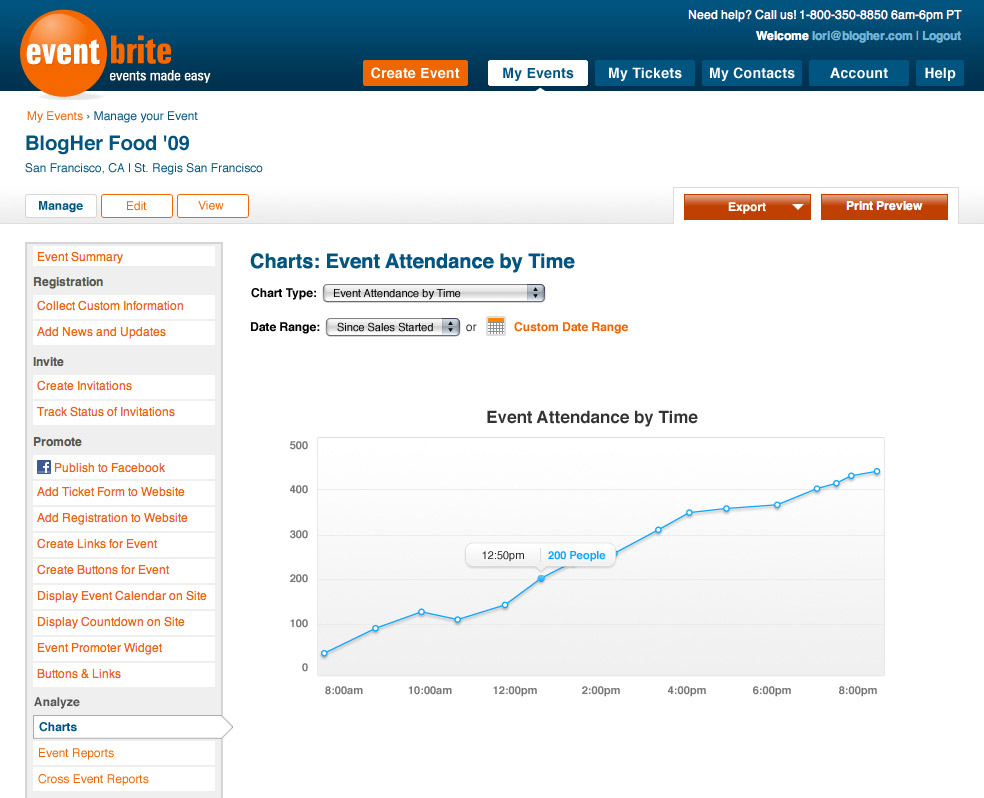
Chart: Event Attendance by Time
When entry management is used, the ability to track check-ins by time is available.
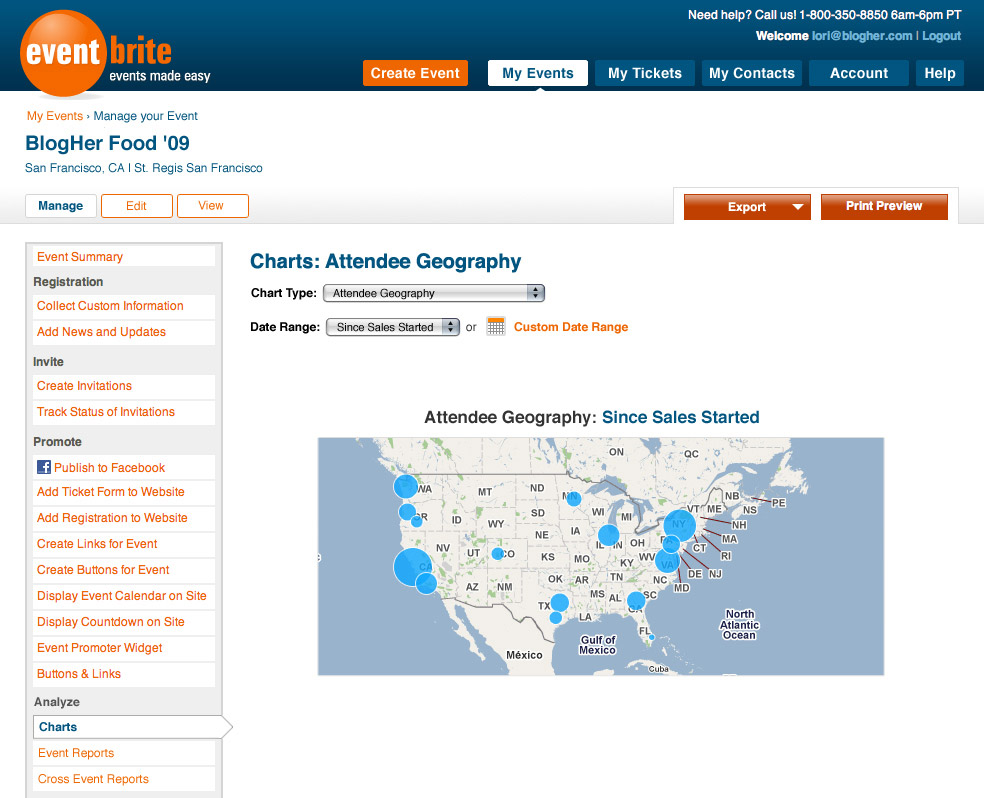
Chart: Attendee Geography
Geolocation data of all ticket purchases visualized
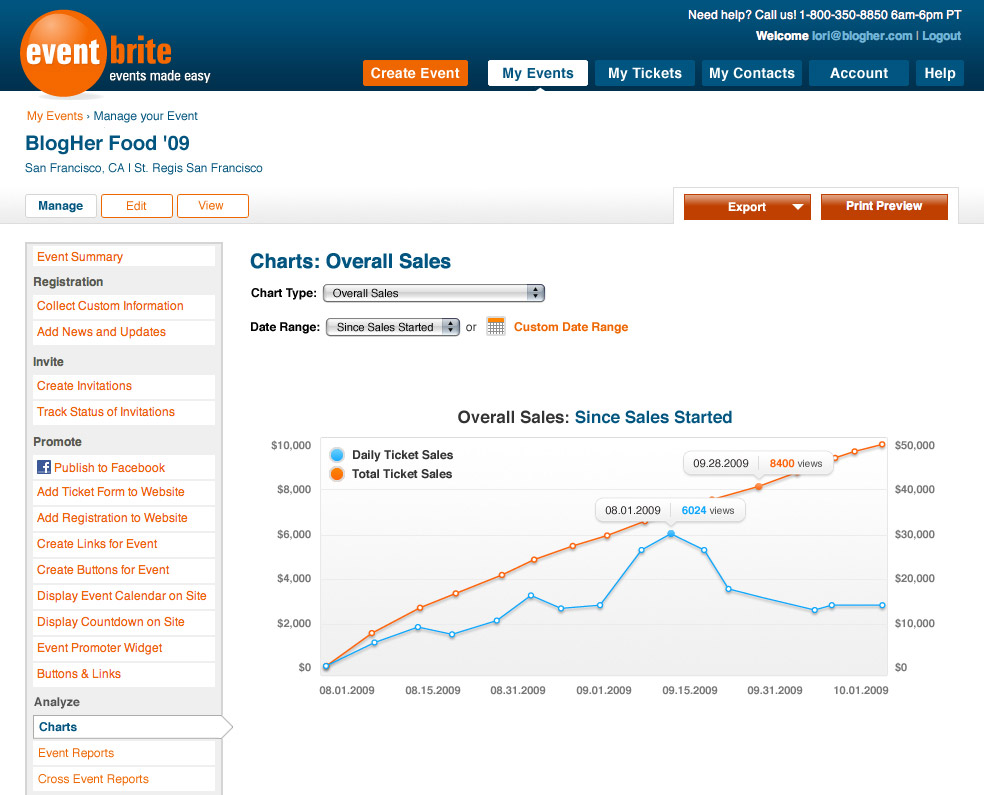
Chart: Overall Sales Since Sales Started
Tracks daily and total ticket sales amounts from the on-sale date to day of the event.

Chart: Discount Code Usage
Shows how many of each discount code have been used.

Chart Exporting
Exporting to PDF, JPEG and PNG formats is available for each chart
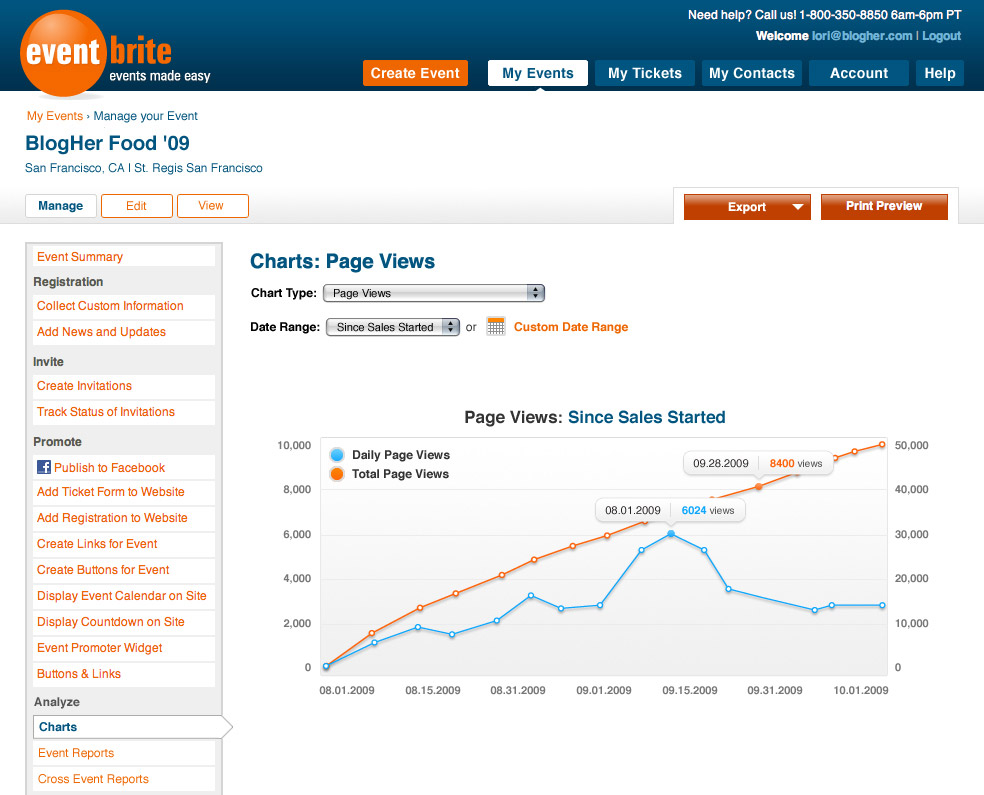
Chart: Page Views Since Sales Started
Daily and total page views charted from the on-sale date to day of the event

Chart: Sales by Ticket Type
A pie chart that shows the breakdown of sales by the various ticket types an event may have.
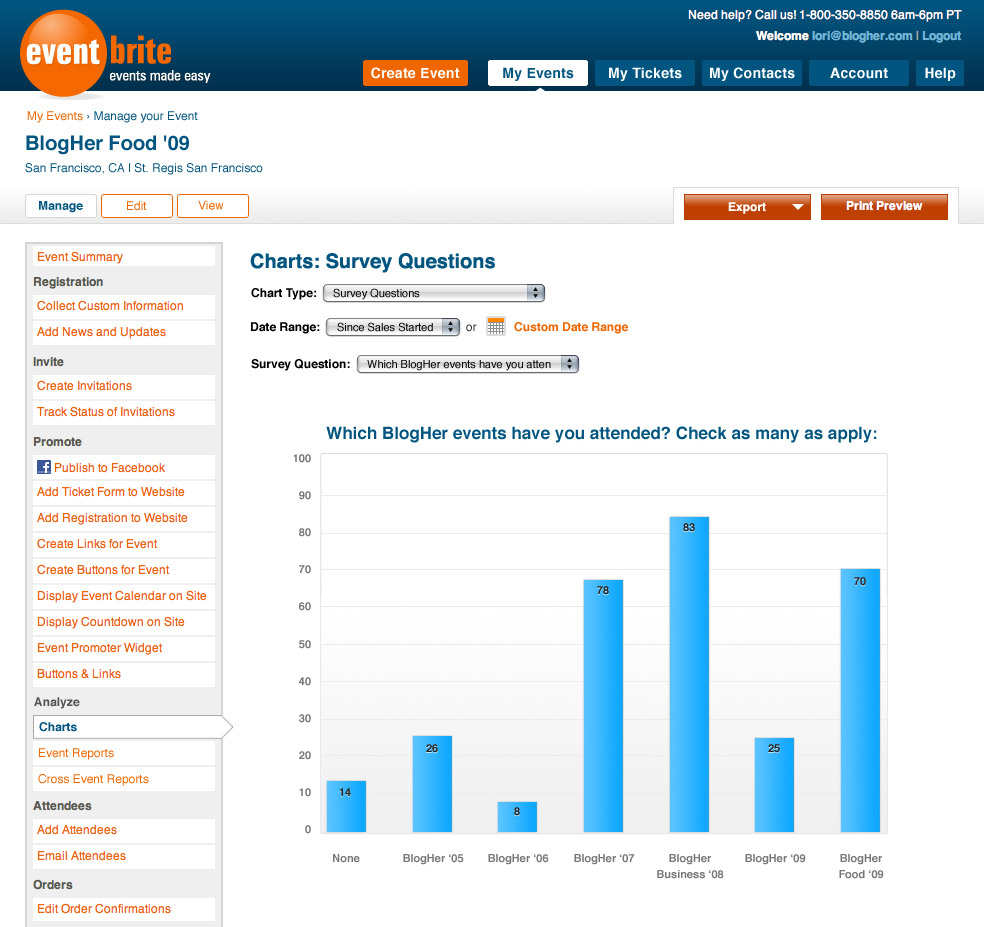
Chart: Survey Questions
Custom data can be collected at the time of registration and this chart visualizes the responses to a single question
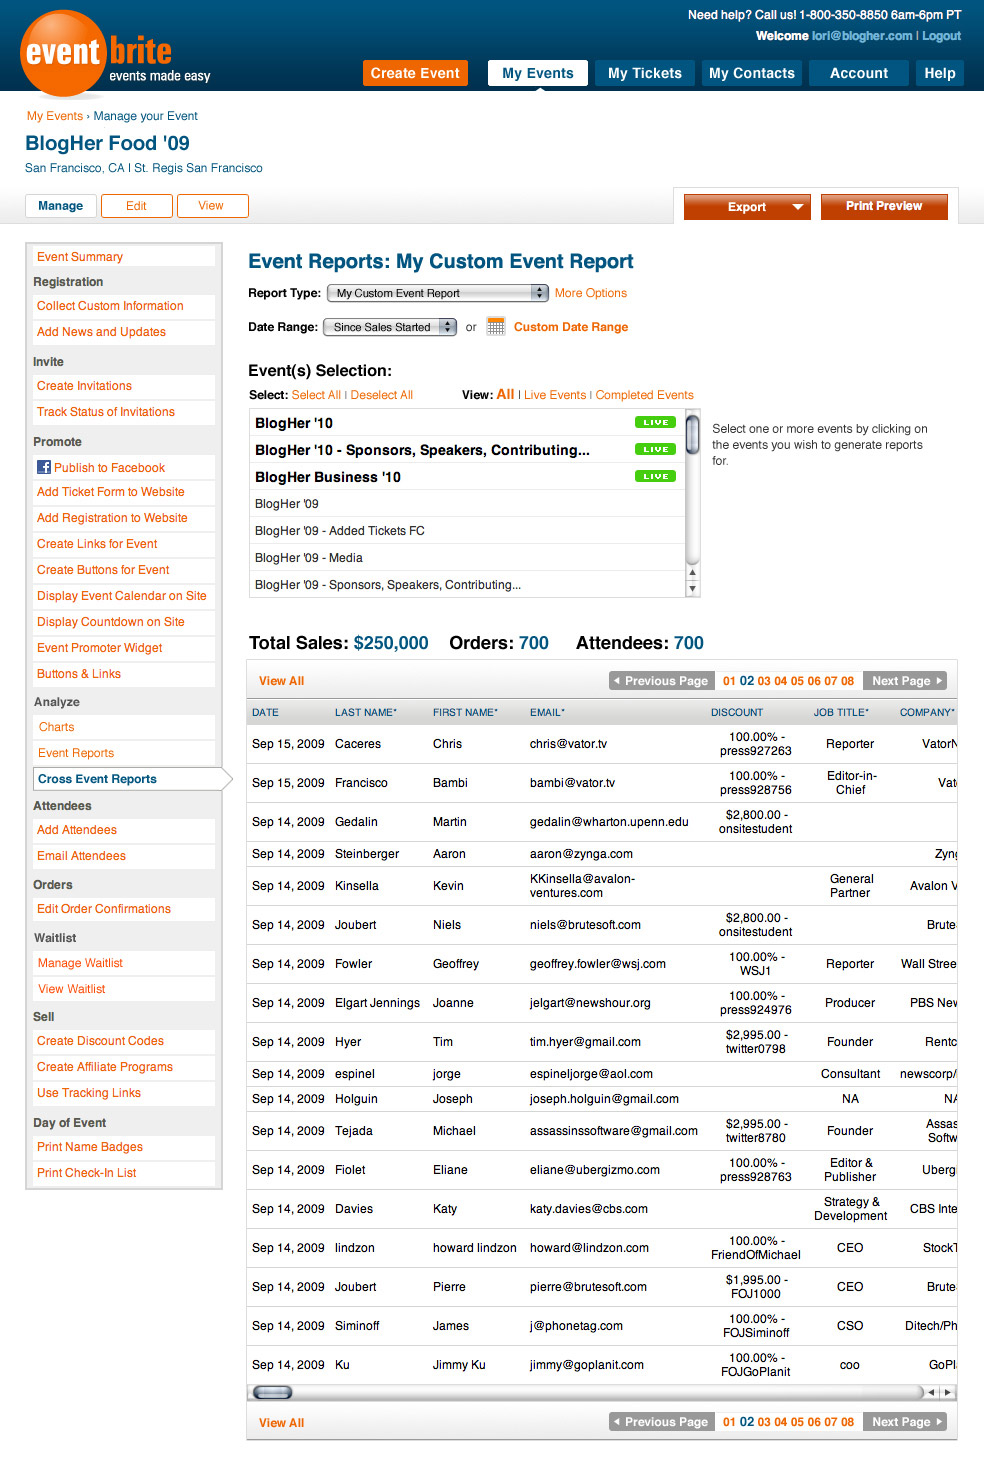
Report: Cross Event Reporting
This is a very powerful reporting tool that enables event holders to create reports based off the data from multiple events that can then be manipulated through advanced filtering, saved as a custom report, and that data exported.
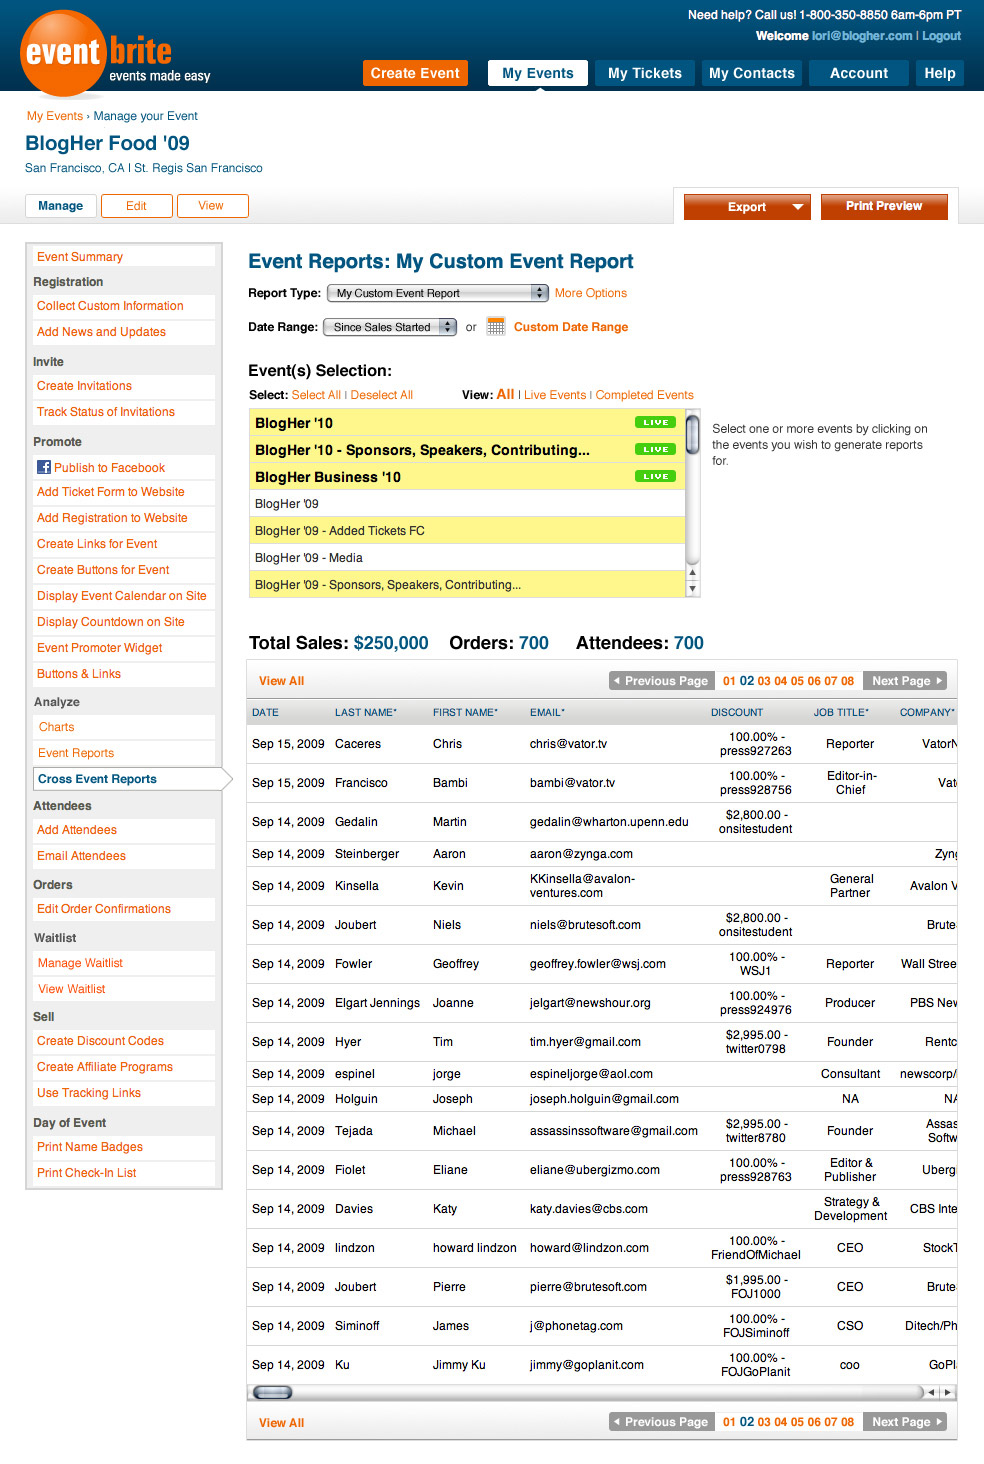
Report: Cross Event Reporting
The simple interface to select which events to pull data from for the report. Clicking on an event selects the event, and another click deselects. The report data table below is updated in real-time as different events are selected, or deselected.

Report: Cross Event Reporting Options
When "More Options" is clicked a lightboxed dialogue with the advanced filtering, data field selection and custom report saving appears. This enables custom reports showing constrained data sets to be quickly created and saved. These reports appear in the report select drop down and accessible by all events.
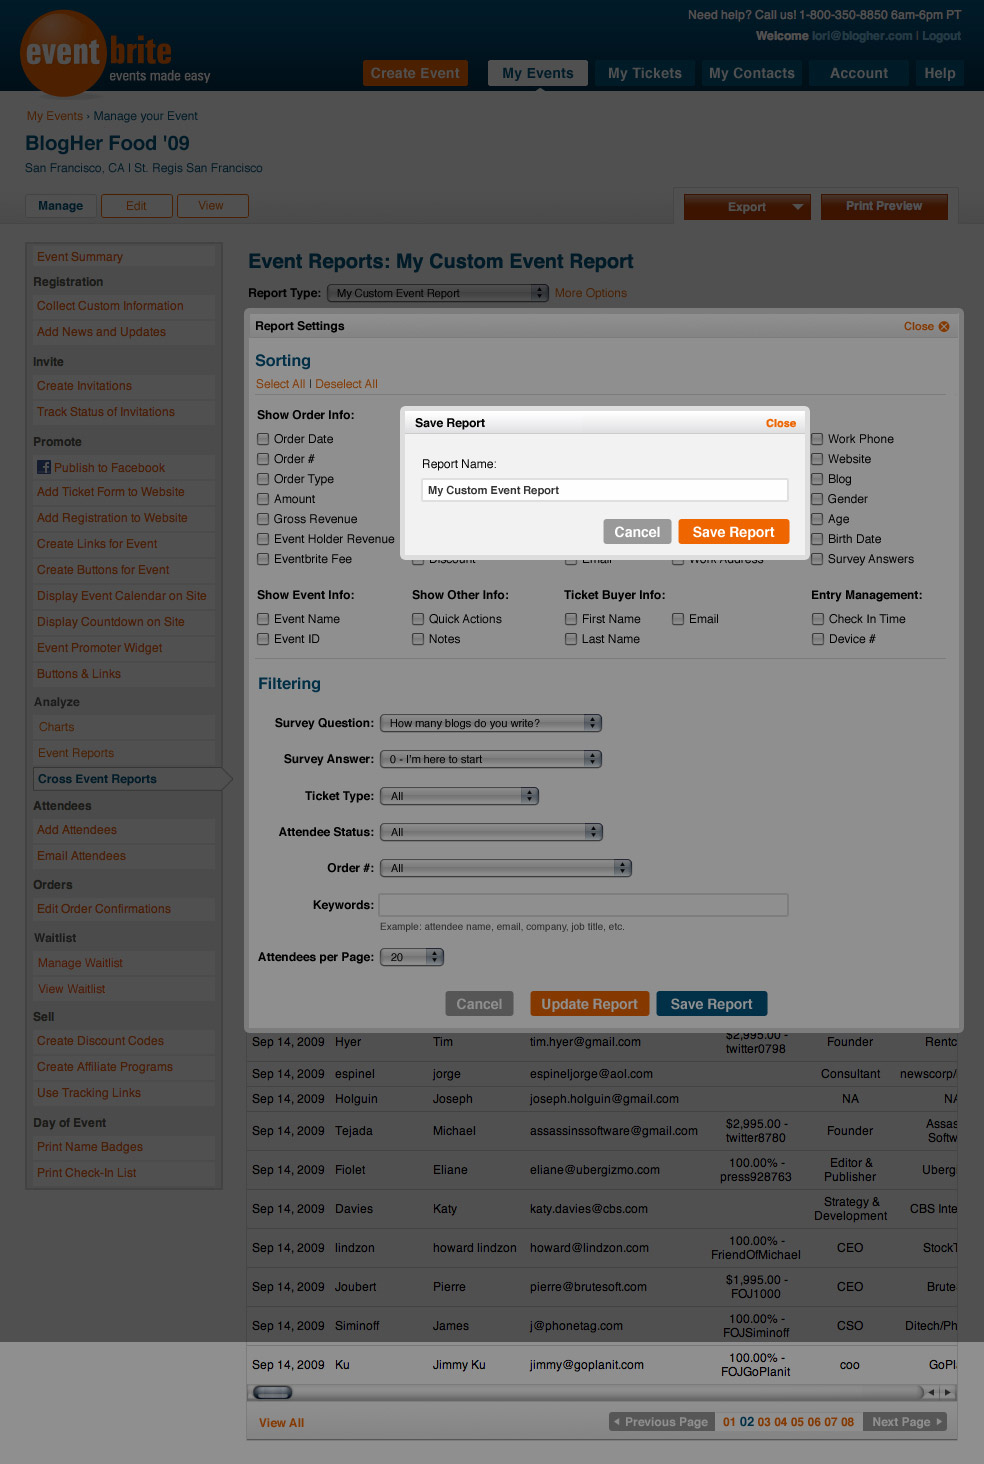
Report: Cross Event Reporting
The save report dialog only requires a name for the report that's different than the default reports Eventbrite provides. Default reports cannot be overwritten, but can be modified and saved as a new report